Showing posts with label blog stats. Show all posts

Saturday, January 14, 2017

First blog stats for 2017


A few years ago, I would occasionally post updated blog stats. Many have told me to use Google analytics to monitor all kinds of neat SEO stuff and other website analytics. I truly think Google analytics is more accurate with the monthly page view account, but in the end...meh the Blogger info is convenient enough and paints a fairly descriptive picture of what is happening.

To be perfectly honest, Even if I had the patience to go through the process, it is HIGHLY unlikely that I would implement any strategies to drive more traffic to the site. I am a gen Xer who really doesn't give a shit about all that sort of stuff. I'm using the site as a virtual financial diary.

I simply like to record my buys and sells and track the results. My tools are the most basic Blogger platforms that I set up 3 years ago and could not set up this blog again now without about 10 hours of grueling, hair pulling frustration. The idea of setting up my dividend spreadsheet which pulls info from Google sheets gives me a headache. Typing links and code and right sizing the charts and then syncing them to the blog really was a pain in the ass!!

I simply like to use my camera phone to photograph the stock purchases and then write a brief summary of my thoughts. It doesn't get more simple than that! Oh yeah, I simply attach the photos because some goofball sent me an email a few years back and insinuated that I was not really investing this much money each month and that my dividends were fictitious.

Since I started posting the photos of the buys and dividends received, I have never heard another peep. I know I shouldn't do all this extra work with the cameras because one little doggie was barking. No biggie, I kind of like seeing the actual transactions on the blog.

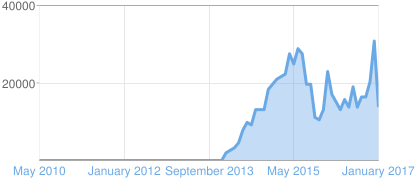
Now if you look at the 1st chart above, you can see that for the first year and a half or so, I had steady increases each month and peaked around 28,000 views. Around August 2015 I was essentially dormant for 5 months as my wife and I went through a divorce.

In January 2016 I started buying and selling again, but was still in hibernation until the middle of the year. This is when the blog activity started to accelerate from a low point of around 10,000 monthly page views.  In December 2016 I actually surpassed 30,000 page views for the first time. Again, the actually count after subtracting various noise is probably several thousand views less.


Who sends me the traffic??

Chart #2 says Google, Dividend MantraPassive Income PursuitCaptain Dividend, and one bad ass dividend building dividend machine named Accumulating Assets are sending me the most traffic each month. There are also some other weird looking websites in that list that I don't really understand.

Dividend Mantra used to send the most traffic, but the site has gone to hell and I can't even leave a comment without joining something. Fucking strange!

Anyway thanks everyone for your continued support and referrals.


Charts #3 and #4 show me which posts received the most traffic and what what my daily, monthly, and all time stats look like.

Damn!!! I still can't believe I hit $14,500 in forward passive income way back in 2014!! I've got some serious work to do....

I'll post more blog updates every couple of months or so going forward.

Friday, May 22, 2015

Blog Stats & My First Google Payment


Today I received my first ever payment from Google. Obviously this is NOT a dividend payment since GOOG doesn't pay dividends. Instead it is my first Adsense payment and it is a whopping $114.25.

I first decided to include ads on the blog around Christmas 2014, so it took about four months to qualify for the first $100 payment. Realistically I could have probably collected aluminum cans and made more money. However, that would require actual work so I probably would have bailed on the idea pretty quickly.

Also here is the latest info on my blog courtesy of Blogger. I started using Google Analytics about a month ago, but I haven't figured out a way to cut and paste a nice clean graph yet.

According to Blogger, April's page views came in at 27,856. As I have mentioned in the past, the Blogger pageview count seems much higher than the actual count. This turns out to be the case as you can see below in the May MTD pageview count comparison.


May 01 through May 21

Blogger pageviews --- 18,378
Google Analytics pageviews --- 13,697

So as you can see, the difference is almost 4700 and that is for only three weeks.

Again, the graph below is from Blogger, but it is the only graph that I can cut and paste....and Yes I am sure there is probably some way that I could export an Excel spreadsheet or Google Docs spreadsheet. Actually I'm not sure that I could do this, but I'm sure many of you probably could. Actually who cares if I can or can't export a graph. Cutting and pasting the Blogger graph works for me and will continue to work for me.

Anyway, I haven't posted much this month, so I will not be reaching new highs. My MTD Adsense total right now is only about $12. Like I mentioned above, it takes a hell of a lot of page views to earn any real money. If I ever reach $50 in a month, it will be a miracle.


Graph of Blogger page views


I hope everyone has a safe and happy Memorial Day weekend.

DEFY MEDIOCRITY

Saturday, April 11, 2015

Random Blog Stats


Graph of Blogger page views


Another month has gone by and I picked up a few hundred more page views in March than in February. As I have mentioned in previous months, these Blogger stats are inflated and I have tried a couple of times to use Google Analytics just so I could have some more accurate data. I have also on several occasions documented my ineptitude with anything related to blog IT stuff.

One of my goals this year is to use the HTML button more and learn a few new skills to help enhance the blog. Usually my progress resembles something like "One step forward, Ten steps backwards."

A few months back I decided to start using Google Analytics and quite honestly, I had trouble even getting the account opened. That is fucking ridiculous. Anyway each month I see reports that others show regarding new unique users, blog traffic, etc. and I find myself jealous. It would be so cool to be able to have something like that.

Recently GEN Y FINANCE GUY suggested to me that I start using Google analytics. He was also kind enough to show me a diagram to help me set it up. The best part is he mentioned that it would only take about 5 minutes to set up. Clearly he doesn't know who he is dealing with.

After spending about 45 minutes on the Google site, I decided to take a break from the computer before throwing the monitor through my office window. I am at work so this would be an H R violation especially if someone outside my office were to get hit with flying glass.

Why do I continue to subject myself to this type of frustration??? I don't know, but the other day at work I told my IT Director that I might take a course in HTML programming.

His simple response: "Why the fuck would you do something like that?"  It looks like he has a pretty good feel for the situation. I'm going to shelf that idea.


So below is the progress that I have made today. I probably am close to finishing, but I don't know for sure.


Right now I am in the Admin page of Google Analytics under the Tracking Info tab and I can see my tracking ID number and there is a sentence next to it that says:
  • STATUS:  Tracking Not Installed

The Google Analytics tracking code has not been detected on your website's home page. For Analytics to function, you or your web administrator must add the code to each page of your website.

Then it says

This is your tracking code. Copy and paste it into the code of every page you want to track.

What follows is a long ass HTML code looking thing that resembles a foreign language.

Just for grins I copied and pasted this code to my most recent post just to see if anything would happen. I had a feeling nothing would happen and I of course I was right.

Also on my Blogger site under Settings - Other, I can see my Analytics Web Property ID with my AU code in the the box. It looks like everything should be working but it isn't.

So anyway enough bitching about my pathetic computer skills. Last month I received $24.51 which is a drop from February's total. April is starting off better as I have reached $13 already and hopefully can surpass $30.


Sunday, March 8, 2015

Blog stats and Adsense revenue update


Even though February was a short month, I still managed to reach 21,934 page views.

Graph of Blogger page views


The spike around Valentine's Day was courtesy of  Dividend Mantra.

Graph of Blogger page views


For the second month in a row I managed to surpass 20,000 page views. This number seems difficult to believe and I am still under the impression that Blogger is giving me inflated results. But like I mentioned last month, similar to dividend investing, if the chart is heading up and to the right it's all good.

I really didn't make any changes to the blog other than I finally added an About Me page and I removed my Run Log.

I haven't stopped running. In fact after several months of various nagging knee and ankle injuries, I have finally gotten completely healthy (knock on wood). The main reason I am not tracking the miles anymore is because my wife got me a Garmin watch which tracks miles, pace, calories, and a few other cool things.

In February my adsense revenue increased to $35.65. This is quite a bit higher than the $20.55 I earned in January. I still have not received any funds because I have not broken the $100.00 minimum threshold. Hopefully by the end of April I will receive my first payment.

One day while roaming around the AdSense dashboard, a box appeared and asked me if I wanted to optimize my ads. I clicked yes (as this involved no effort on my part) and as far as I can tell my ads have become more COLORFUL and animated. Then again, this could be entirely my imagination. Usually the "optimizing my revenue" section within Adsense entails steps to resize and reshape my ads. Considering it took many hours to get the ads to properly appear (meaning "webpage cannot be displayed" did not pop up) in three locations I opted to avoid this altogether. As you may or may not remember, the last major change to my blog accidentally wiped out the borders surrounding my posts. I have to admit this still chaps my ass.

I have also been noticing that many of you have affiliate websites that seem to be much more effective at generating revenue. I was thinking about adding a Sharebuilder affiliate box to my site if it is available. Since I use their product and make purchases weekly, I certainly think it is a good and cost effective way to build positions in companies.

I guess I should see if Sharebuilder even offers an affiliate option. Then the hard part would be actually installing that into my site. The thought of trying to do that without screwing something major up is one of the reasons I haven't even looked into this yet. I know, I know....I have got to change with the times and tackle new projects. These things probably can be done in a matter of minutes for most of you, but continue to be a thorn in my side. Oh well, I will explore this option very soon.

Thanks to everyone who stops by to visit. I truly enjoy the interaction and support you guys provide. Your encouragement and advice is taken very seriously and I believe information is our most important asset and am always looking for new ideas.

Stay relentless in your pursuit of FI. I certainly plan to!!!

DEFY MEDIOCRITY


Sunday, February 8, 2015

Blog stats update and adsense revenue


The chart below shows a continued upward trend through January.

Graph of Blogger page views

Here are my January daily views.


Graph of Blogger page views


20,000 page views???

According to Blogger I reached 20,852 page views during January which is my highest total ever. I don't know how accurate that number is as I sometimes have a giant spike in the middle of a day that seems like a false reading. In any event, the trend continues to move higher each month so that is pretty cool. Another thing that I have noticed is that my daily views rarely fall below 500 and average around 700 views a day. Again these blogger stats are probably a bit inflated, but the trend is heading up.

U.S. concentrated readership

Recently I I have noticed that most of my visits (about 75%) are from the United States so I decided to add the Translator gadget to my blog so if anyone outside the U.S. stops by they can read it in their native language. This seems to be working as I have noticed Europe is turning greener on my audience map. Surprisingly I have very few people from Canada visiting my site. To be honest I'm not really doing anything to try and increase traffic. I view the visits I receive as random and am thankful to those who periodically stop over.

This was my first full month using AdSense and I had a pretty good month earning over $20 in January. The exact amount was $20.55.

Sometimes I think the amount is too small and insignificant, but then I realize that my first dividends received back in early 2012 was pretty small also. I will probably keep the ads alive as I hate to leave any potential income on the table. After all $20 a month is like a year's worth of dividend income from a $10,000 JNJ position. After thinking about it like that I'll go ahead and keep the ads and hope they grow in the future!

So far in February I've made $7, so maybe I can hit $25.00 in month number two. We'll see.

I have been playing around practicing with the HTML button and now I realize it is not as bad as I kept thinking it was. I try to learn a new function here and there although I noticed my graphs still have a black background, but that is cool. There are more important things in this world to focus on than graph background colors.

MDP

Monday, December 1, 2014

Random Blog Charts


Last week Asset Grinder posted some of his blog stats.  That got me to thinking what do my blog stats look like? Quite honestly I really never expected anyone to stop by. But I certainly am glad people find some benefit to my weekly posts. Anyway the last month, last week, and the YTD charts are shown below.

Why are my charts blacked out? Who the hell knows. Other than a few random "cut and paste" codes that I copied from a Google search, I have not made any technical adjustments as those  could prove fatal to an already fragile blog structure. :-) Copying and pasting these charts along with trying to write on the side of the charts was a chore in itself. This may be the first and last time I ever do this. And why is the word time in the last sentence out of line???? 


Graph of Blogger page views
What happens when Dividend Mantra mentions you on his blog? That big spike up over 2,100 page views in one day is what happens. That is like a giant steroid boost!

Graph of Blogger page views


My typical week normally looks like the chart on the left between 400 and 600 views a day.


Graph of Blogger page viewsAfter a rather slow start back in January, My pageviews have increased each month. In November I had 17,950 pageviews for the month. Will I ever reach 20,000 pageviews? Odds are probably better that I hit $20,000 in forward dividends first.